Appendix 3: Chapter 2 Supplementary Materials
Article title: Topography consistently drives intra- and inter-specific leaf trait variation within tree species complexes in a Neotropical forest
Authors: Sylvain Schmitt, Bruno Hérault, Émilie Ducouret, Anne Baranger, Niklas Tysklind, Myriam Heuertz, Éric Marcon, Saint Omer Cazal, Géraldine Derroire
The following Supporting Information is available for this article:
Fig. 30. Principal Component Analysis of abiotic topographic variables.
Fig. 31. Diameter at breast height and Dawkins index correlation.
Fig. 32. Diameter at breast height distribution between sampled indivduals and other Symphonia and Eschweilera individuals of Paracou.
Tab. 9. Log-likelihood for diameter model depending on model form (linear vs Michaelis-Menten).
Fig. 33. Effect of tree diameter on leaf functional trait variation.
Fig. 34. Species niche breadth along the topographic wetness index for all species from Paracou.
Fig. 35. Random effects of plots on leaf functional trait variation.
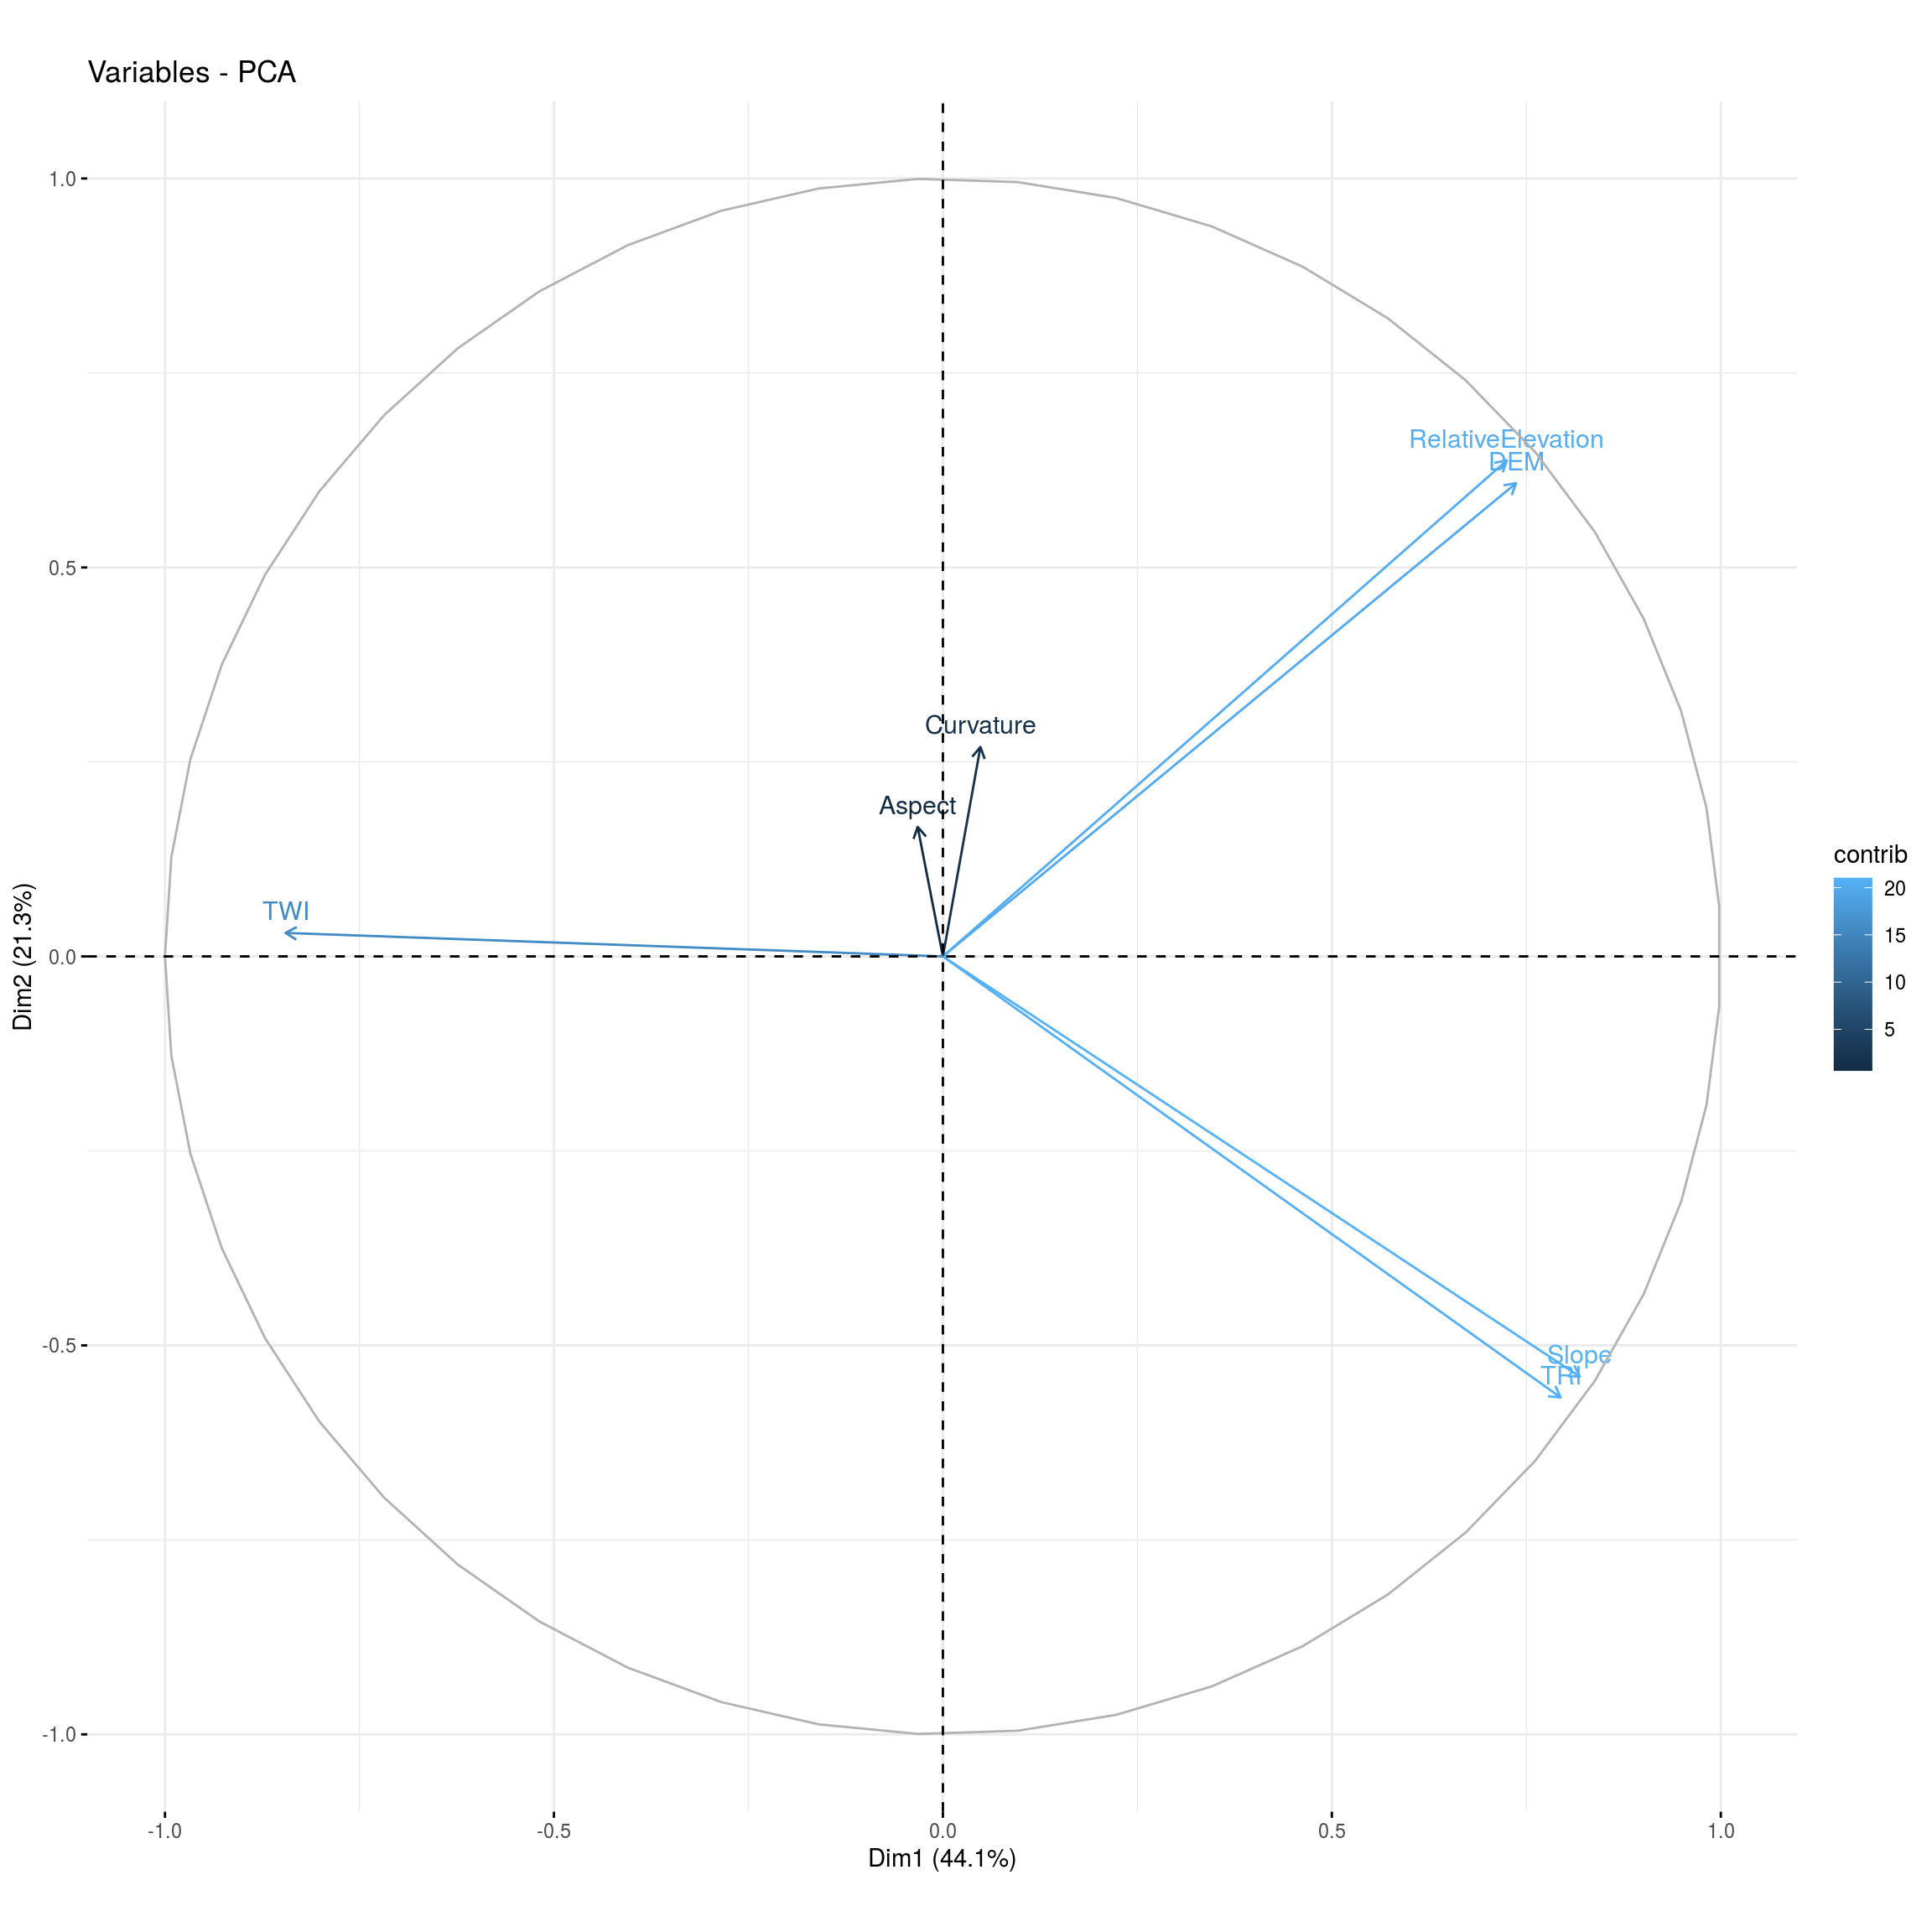
Figure 30: Principal Component Analysis (PCA) of abiotic topographic variables. All variables, slope, curvature, aspect, topgraphic rudgeness index (TRI), and topgraphic wetness index (TWI) are derived from the digital evlevation model (DEM) obtaine through LiDAR campaign in 2015.
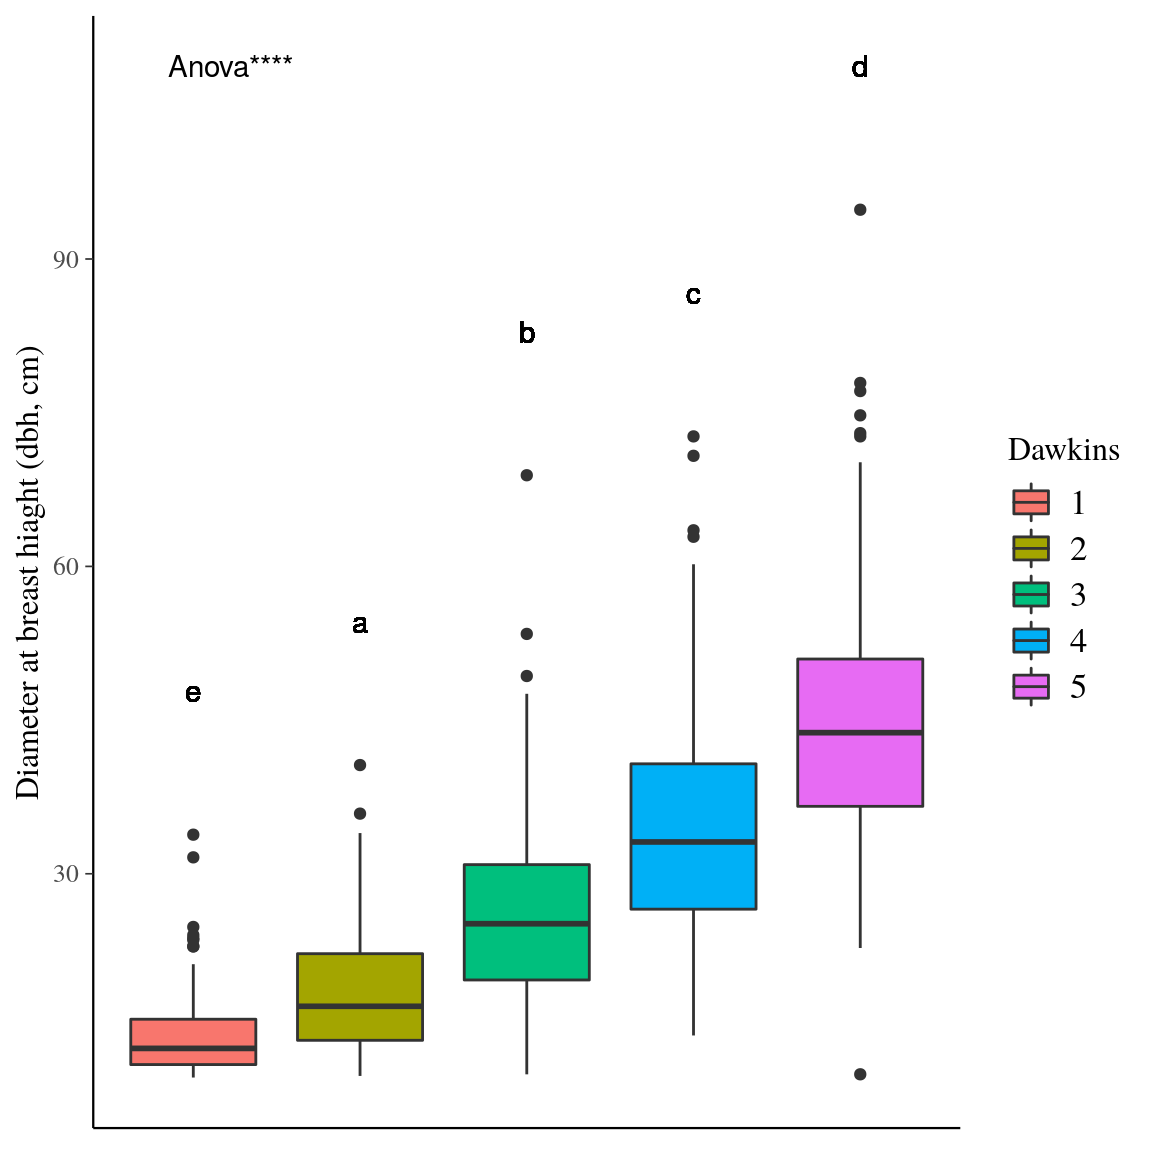
Figure 31: Diameter at breast height (DBH) and Dawkins index correlation. Box colors indicates the Dawkins index. DBH and Dawkins index correlation has been investigated by Anova. **** indicates a . Letters indicate post-hoc groups investigated by Tukey Honest Significant Differences.
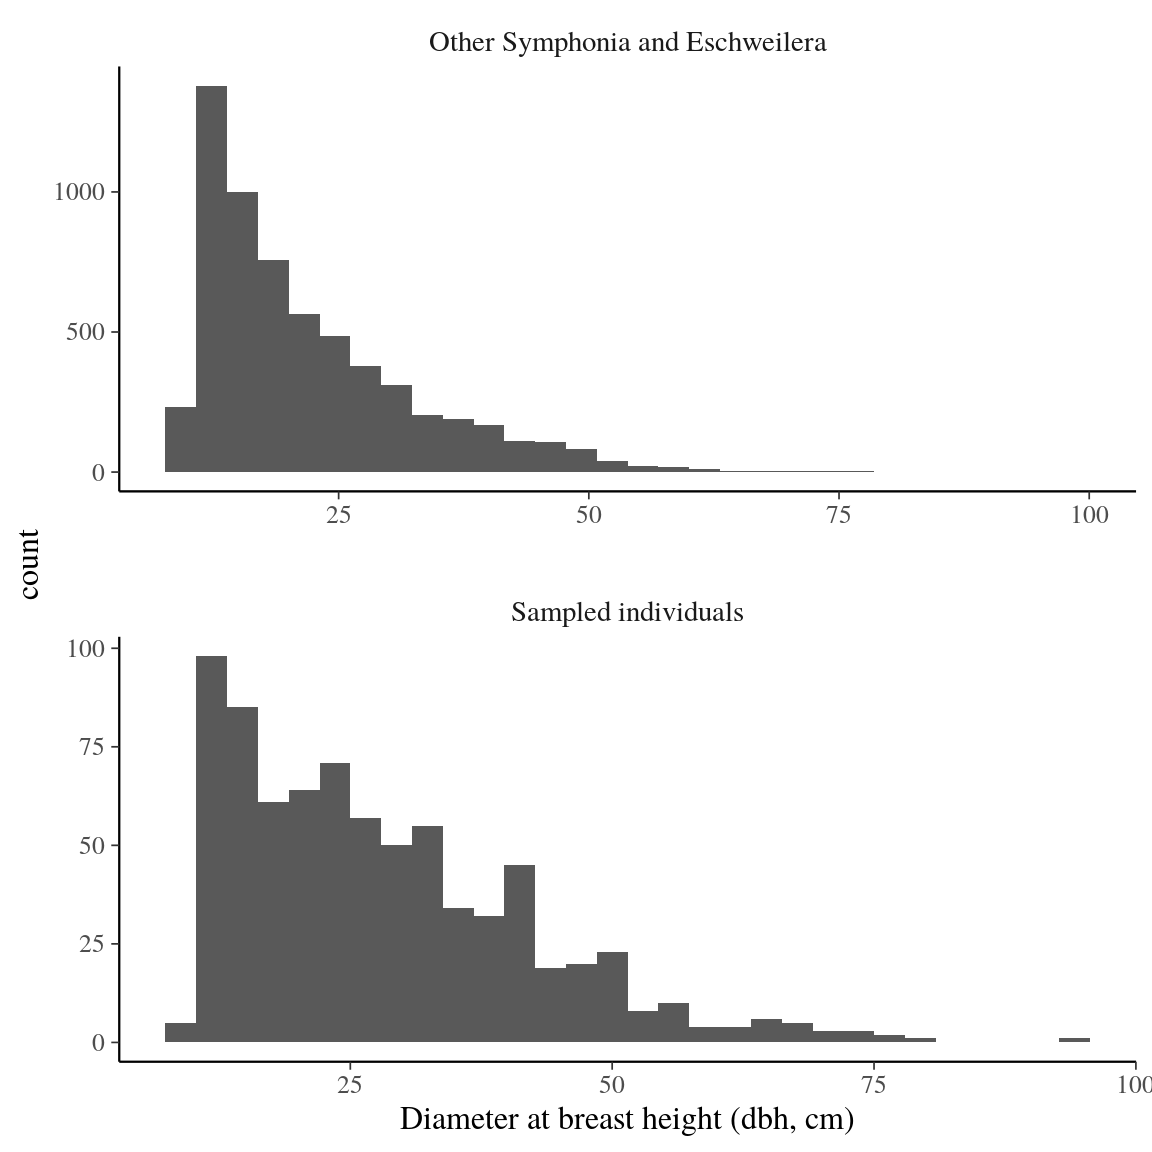
Figure 32: Diameter at breast height (DBH) distribution between sampled indivduals and other Symphonia and Eschweilera individuals of Paracou.
| Genus | Trait | Linear | Michaelis Menten | Difference |
|---|---|---|---|---|
| Eschweilera | -85.212 | -78.300 | -6.911 | |
| Eschweilera | -42.237 | -44.454 | 2.217 | |
| Eschweilera | -14.265 | -8.660 | -5.605 | |
| Eschweilera | 411.503 | 414.119 | -2.615 | |
| Eschweilera | -190.383 | -192.942 | 2.559 | |
| Symphonia | -103.963 | -97.755 | -6.208 | |
| Symphonia | 48.134 | 56.714 | -8.580 | |
| Symphonia | -159.831 | -159.919 | 0.088 | |
| Symphonia | -91.641 | -86.634 | -5.006 | |
| Symphonia | -185.400 | -176.199 | -9.200 |
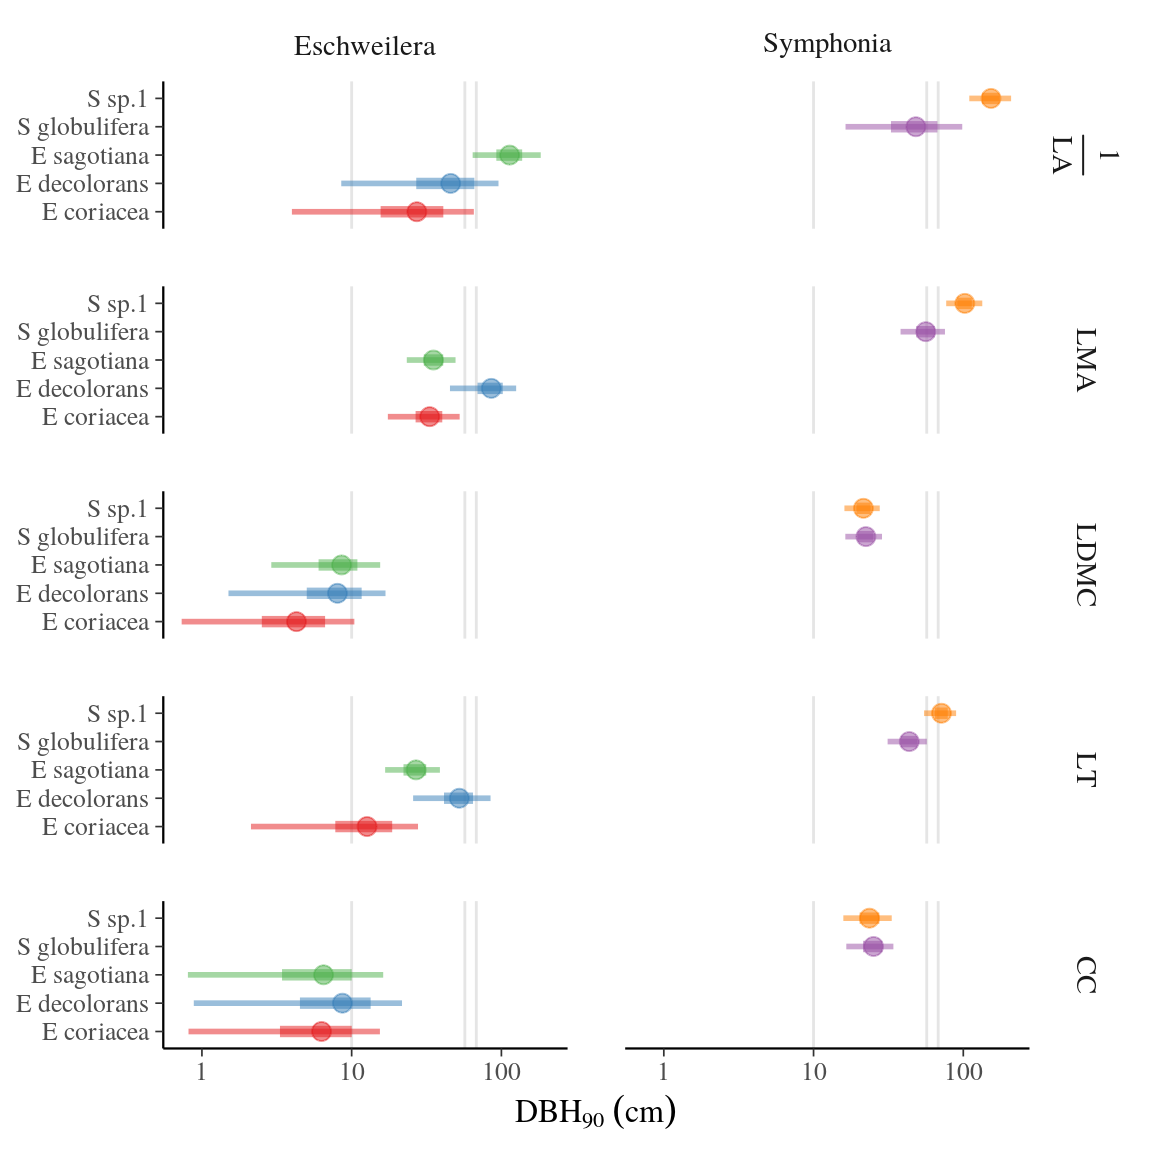
Figure 33: Effect of tree diameter on leaf functional trait variation. The posterior distribution of species diameter at breast height for which a given trait reaches 90% of its maximum value () was estimated for every trait for all species in both complexes using Bayesian inference. Circles represent the mean estimate, thick lines the 50% confidence interval and thin lines the 95% confidence interval, and color the corresponding species. Vertical lines indicate from left to right: (i) tree recruitment diameter and (ii) and (iii) 95th percentile of diameter for Eschweilera and Symphonia, respectively.
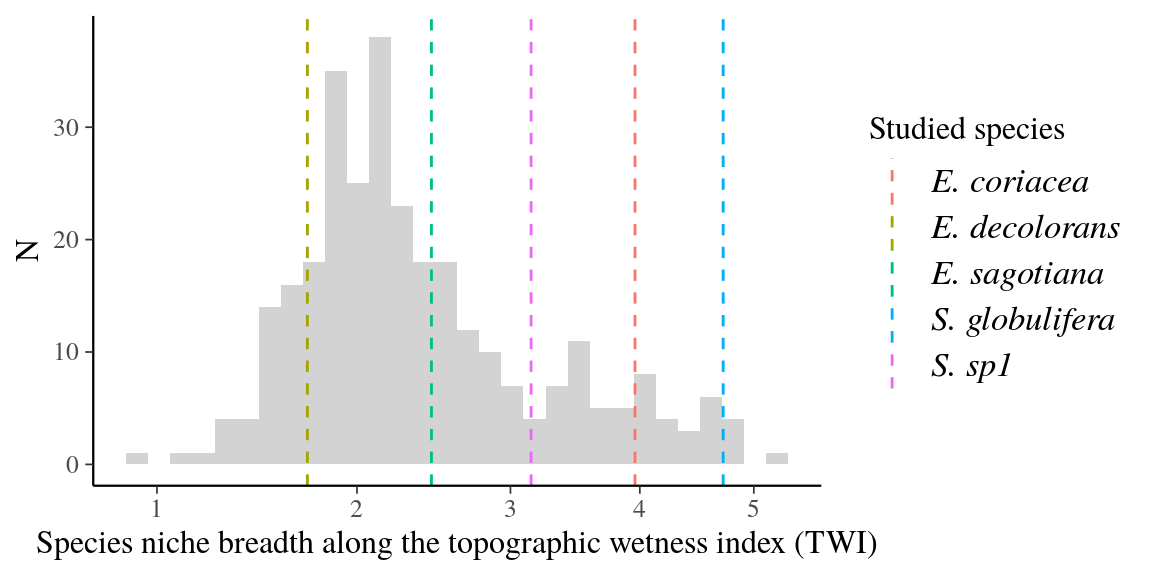
Figure 34: Species niche breadth along the topographic wetness index (TWI) for all species from Paracou. Niche breadth has been calculated as the difference between the 95th quantile and the 5th quantile of TWI for all species from Paracou with at least 20 individuals. Dashed vertical lines represent niche breadth value for species from this study indicated by line color. E. coriacea and the two Symphonia species have bigger niche breadth than most Paracou species but E. sagotiana and E. coriacea have niche breadth similar to the majority of Paracou species.
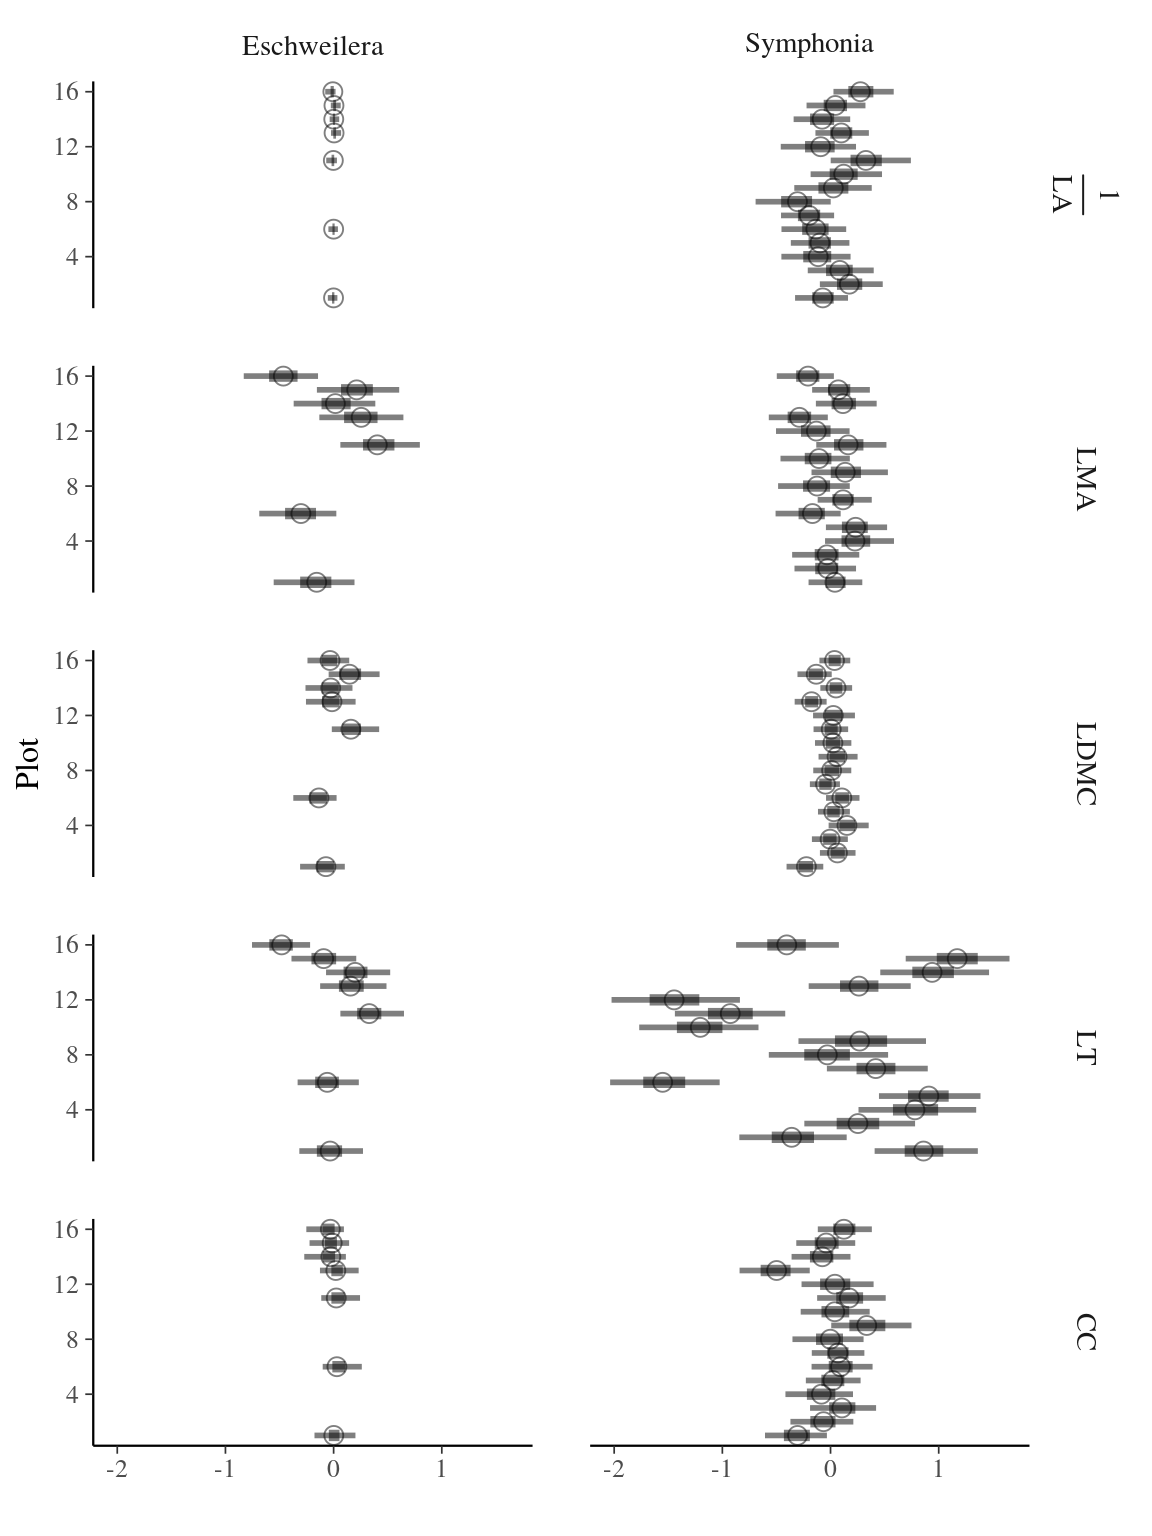
Figure 35: Random effects of plots on leaf functional trait variation. The posterior distribution of plot effect was estimated for every trait for all plots in both complexes using Bayesian inference. Circles represent the mean estimate, thick lines the 50% confidence interval and thin lines the 95% confidence interval, and color the corresponding species.